.webp)
What Capital Markets Really Value
Investors do not value quarterly results. They value the quality of future cash flows along three dimensions: growth, durability, and risk.
The empirical evidence is clear: growth is valued at a 2-3x higher multiple than profitability at the capital market level (Rule of X, Bessemer Venture Partners).
But not all growth is equal. Growth driven by overly aggressive new customer acquisition without corresponding retention can dampen value development. Growth through price dumping shifts problems into the future. The decisive question is not only how strongly a company grows, but above all how sustainably.
This is where the central challenge for management lies: How does one steer growth in a way that translates into stable, profitable cash flows over the long term? How does one distinguish value-creating from value-destroying growth? And how does one make this quality transparent for investors?
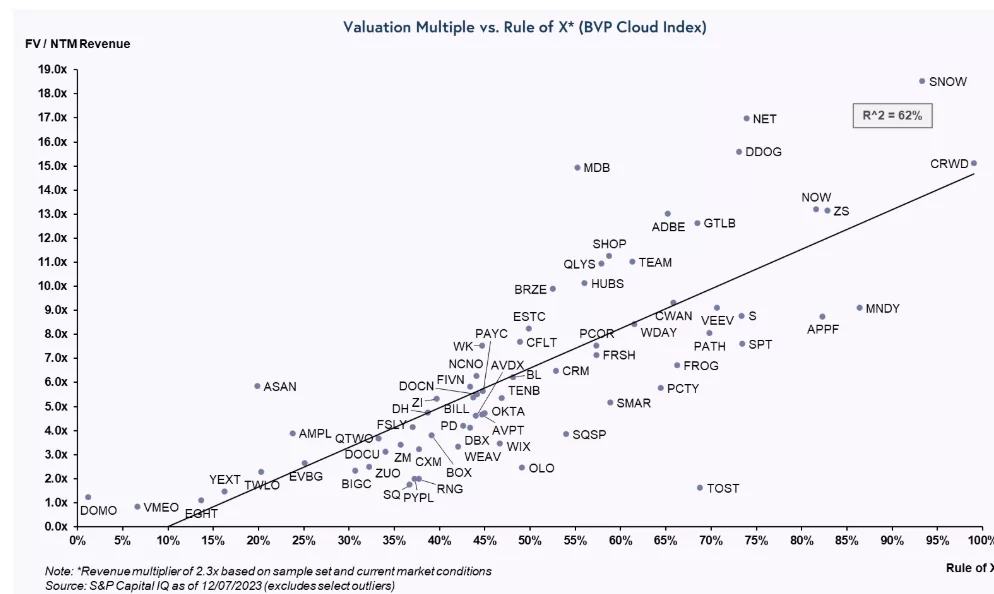
Source: https://www.bvp.com/atlas/the-rule-of-x
Why Traditional Metrics Are Not Enough
The typical steering metrics - revenue growth, EBITDA margin, CAC, churn rate - reveal symptoms, not drivers. They exist in isolation from one another and are often optimised separately by different functions:
- Marketing optimises CAC - without understanding whether cheaper customers generate less value
- Product optimises features - without detailed transparency into which features drive retention
- Sales optimises deal volume - without measuring which customer segments are profitable
The result: every function optimises its own metric. Nobody optimises overall value. Growth and profitability are treated as a trade-off, not understood as a system.
What can help here is an integrating logic that shows:
- How investments in acquisition amortise over the customer lifecycle
- Which customers, segments, and channels actually create value
- Whether growth increases or reduces return on capital
- How unit economics develop at scale
This is precisely the gap that Customer Lifetime Value closes.
CLV as an Integrating Steering Logic
Customer Lifetime Value is therefore not simply another metric. CLV is the only metric that integrates all four dimensions of sustainable value creation:
- Acquisition - Which customers do we win, at what cost?
- Monetisation - How much value do these customers generate over what period?
- Retention - How long do they stay, and what drives loyalty?
- Expansion - How do we increase the value of existing customers?
CLV forces the organisation to view these dimensions not in isolation, but as a system. Every investment decision becomes transparent: Does it increase the expected customer lifetime value? At what cost? With what degree of certainty?
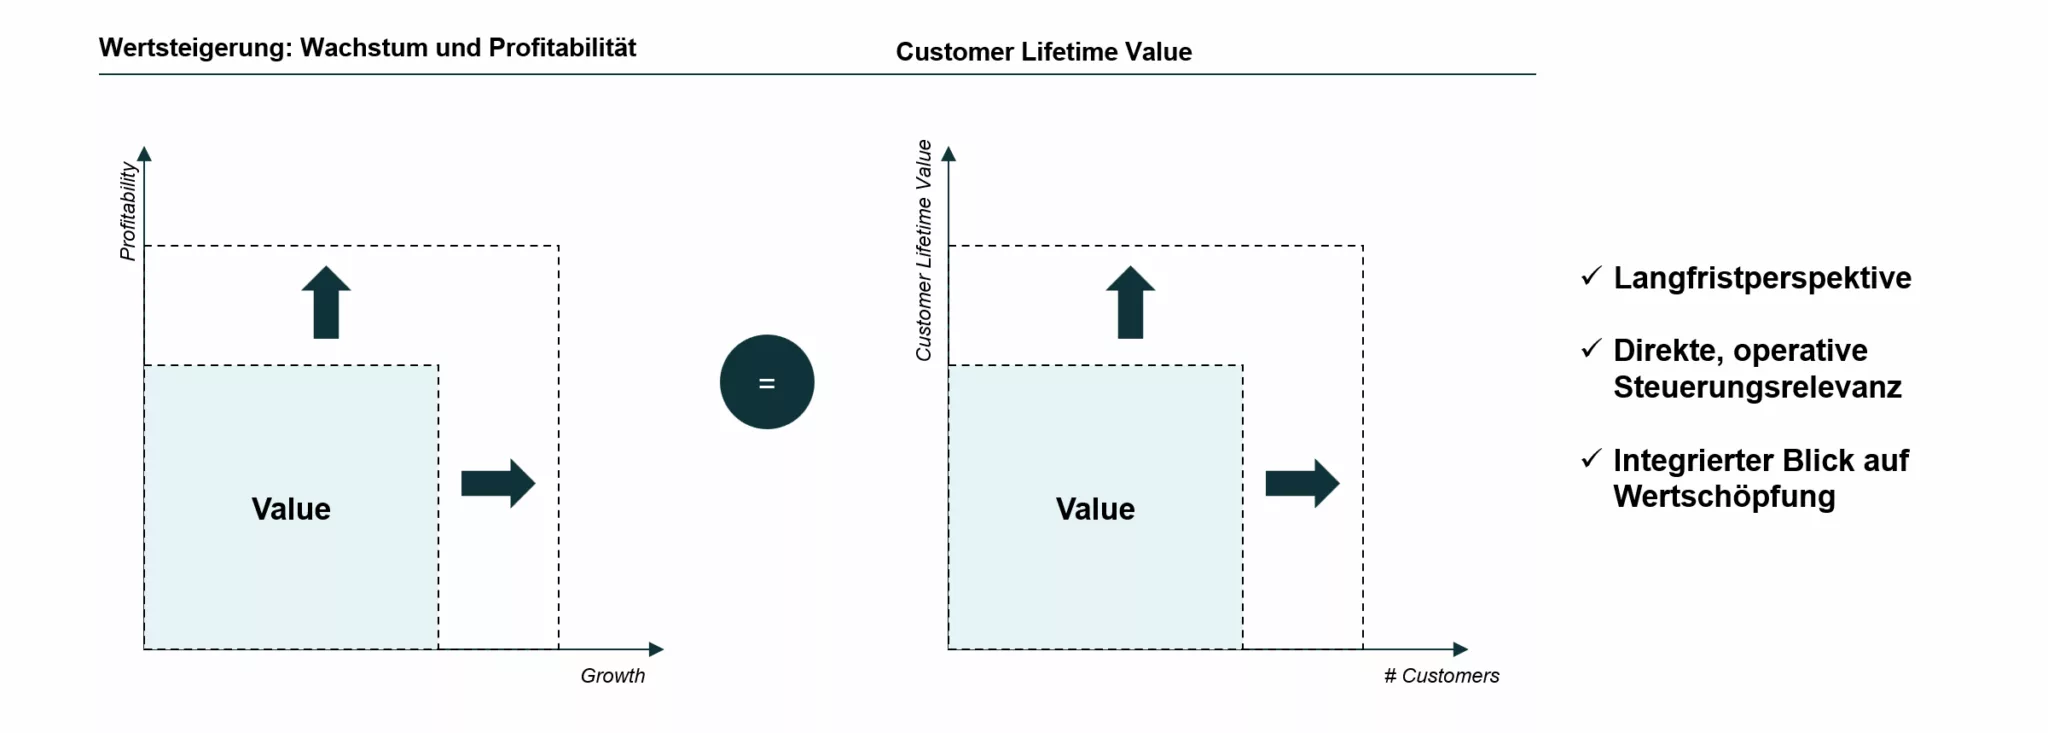
CLV thus becomes the operational anchor between strategy and enterprise value. It translates the abstract demand for "sustainable growth" into concrete, measurable steering logic.
The Four Perspectives of CLV
1. Growth Quality: Value Creation vs. Value Destruction
Traditional metrics show that a company is growing. CLV shows how sustainably.
A revenue growth of 50% can represent two completely different economic realities:
- Company 1: LTV/CAC = 5:1 - every acquired customer immediately creates value
- Company 2: LTV/CAC = 1.5:1 - growth typically destroys capital, as additional fixed costs, overhead, product development, risk, and cost of capital leave no viable value contribution
Both grow at the same rate. But only Company 1 generates a positive investment cycle: higher CLV allows higher acquisition costs - better channels - better customers - higher retention - even higher CLV. Company 2 finds itself in a downward spiral of declining CLV and increasing acquisition pressure.
The CLV perspective: growth is only value-creating when it is based on rising or stable customer lifetime values. CLV separates profitable from burn-driven growth and makes this distinction visible before it impacts earnings.
2. Scalability: Unit Economics at Expansion
Traditional metrics show current margins. CLV shows whether a business model improves or deteriorates at scale.
Aggregated metrics (70% retention, 58 euros ARPU) can obscure the fact that newer cohorts are fundamentally more valuable:
- Cohort 2020: CLV 125 euros (60% retention, 50 euros ARPU)
- Cohort 2023: CLV 325 euros (80% retention, 65 euros ARPU)
Newer customers are 2.6x more valuable. This signals that the company is learning. Unit economics are improving. Future growth will be more profitable than past growth.
The CLV perspective: cohort analyses show the trajectory of the business model, not just its current state. This development justifies higher multiples because it proves that scaling creates value rather than diluting it.
3. Forward Perspective: Value Before Accounting Realisation
Traditional metrics are based on historical data or short-term forecasts (12 months). CLV captures value creation across the entire customer lifecycle (3 to 7 years), making value visible before it appears in earnings.
In growing subscription models, acquisition is immediately booked as an expense, while customer value is realised over years:
- Year 1: 1,000 euros revenue, 1,500 euros CAC - 500 euros loss (accounting)
- Years 2 to 5: 5,000 euros lifetime revenue - 4,500 euros lifetime profit (reality)
Earnings-based multiples are often negative or extremely high for growth companies. CLV shows the actual economic value at the point of acquisition.
The CLV perspective: CLV explains why investors are willing to pay high revenue multiples for companies with negative earnings - and makes this implicit valuation explicit and verifiable.
4. Risk Profile: Cash Flow Stability Rather Than Isolated Profitability
Traditional metrics are often backward-looking and indicate achieved profitability. CLV can be used to measure and steer future profitability.
Example: two companies with identical current EBITDA margins can have fundamentally different risk profiles:
- Company 1: 95% retention - CLV 20,000 euros - 20 years average customer lifetime
- Company 2: 70% retention - CLV 3,333 euros - 3.3 years average customer lifetime
Company 1 can forecast cash flows over two decades with high confidence. Company 2 must continuously re-acquire customers to maintain revenue. This difference in predictability justifies different discount rates - and therefore different valuations - despite identical current profitability.
The CLV perspective: retention is not an operational KPI, but the strongest value driver. A retention improvement from 90% to 95% doubles CLV - because it acts not linearly, but multiplicatively across the entire customer lifecycle.
From Metric to Management Architecture
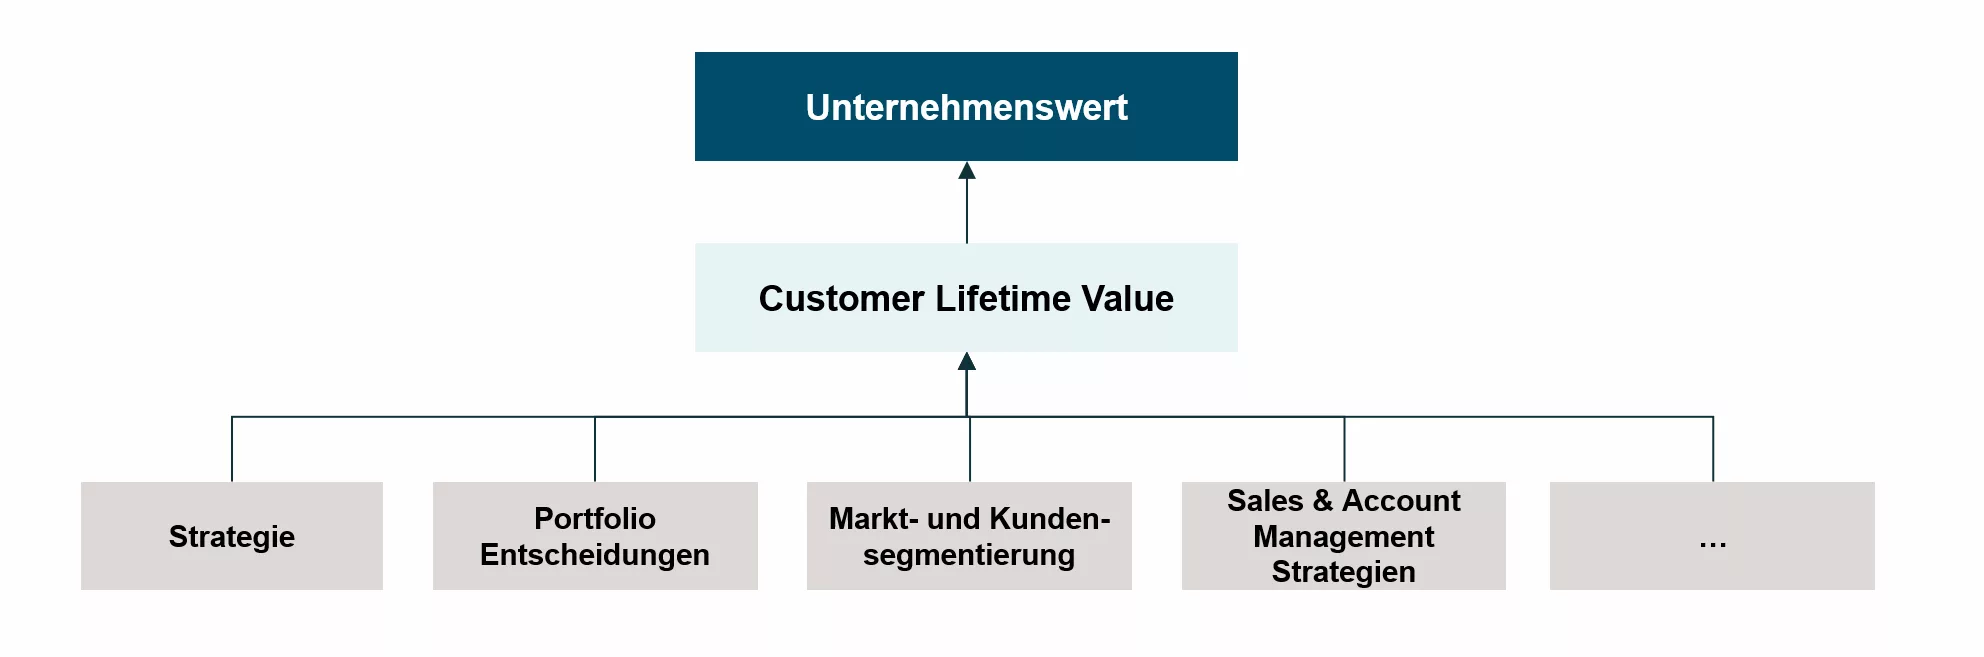
CLV is not a dashboard KPI. CLV is a decision logic that fundamentally changes planning and strategic steering. Examples include:
Portfolio decisions: New markets are only entered when the expected CLV clearly exceeds acquisition and operating costs - including realistic assumptions on churn and competitive dynamics.
Capital allocation: Budget flows not by function, but by value contribution. A channel with 500 euros CAC and 95% retention (CLV 20,000 euros) is dramatically superior to a channel with 200 euros CAC and 70% retention (CLV 3,333 euros) - despite four times higher acquisition costs.
Customer segmentation: The organisation stops treating all customers equally. High-value segments with CLV of 20,000 euros and above are prioritised for acquisition - even at 1,000 euros or more CAC. Low-value segments with CLV of 2,000 euros are deliberately not pursued.
Product decisions: A feature that increases ARPU by 10% but reduces retention from 90% to 85% reduces CLV by more than 25% and is not built.
Process efficiencies: Breaking down CLV into its operational drivers - such as the contribution of procurement, production, and sales - helps optimise processes and directly link process logic with value creation logic.
The Mechanism of Sustainable Value Creation
Companies with systematic CLV management create three effects that drive valuation premiums:
1. Lower risk perception: Higher retention means longer average customer lifetime. Longer average customer lifetime means more predictable cash flows. More predictable cash flows justify lower discount rates.
2. Capital efficiency: Rising CLV allows higher acquisition costs. Higher acquisition costs enable better channels and faster growth. Faster growth at a constant CLV means: growth finances itself.
3. Strategic resilience: Companies with high CLV are less dependent on continuous new customer acquisition. They can weather downturns more effectively because their cash flows come from existing customers, not from permanent growth pressure.
This combination of growth, durability, and reduced risk explains why companies with strong CLV metrics are systematically valued at premium multiples.
Conclusion: CLV is the Anchor Between Strategy and Value
The fundamental insight: enterprise value does not emerge from short-term optimisation, but from the sustainable ability to acquire customers, retain them, and increase their value across the entire lifecycle.
Customer Lifetime Value is the operational translation of this logic. It integrates four dimensions that traditional metrics only capture in fragmented form:
- Growth quality - the separation between value-creating and value-destroying growth
- Scalability - whether unit economics improve or deteriorate at expansion
- Forward perspective - capturing value before accounting realisation
- Risk profile - the difference in customer lifetime is fundamental to cash flow predictability
For top management and investors, this means: CLV is not a marketing metric. CLV is the central lever that shows whether today's investments lead to stable, scalable, and high-return cash flows tomorrow.
Companies that manage CLV systematically do not only create higher valuations - they build more resilient, more predictable, and more capital-efficient business models.